Technical Indicators & Analysis
PtView Workstation includes 40+ built-in technical indicators computed in real time with smooth incremental updates on every candle tick.
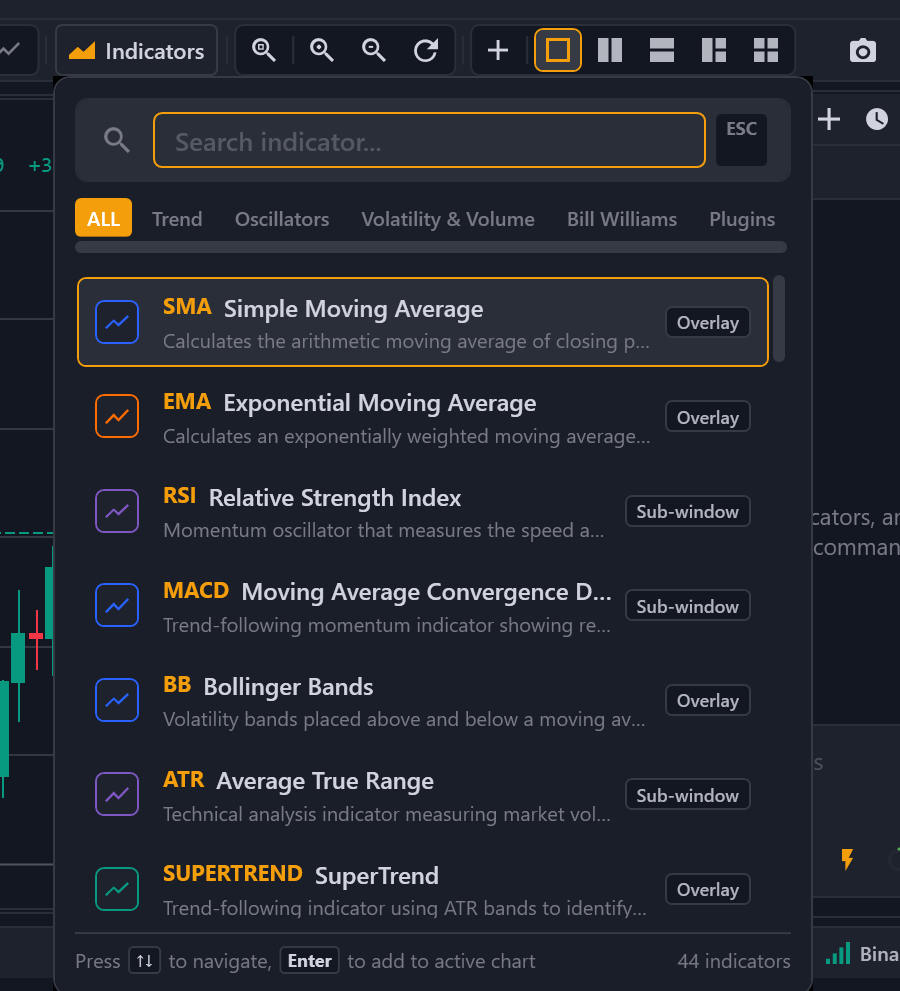
1. Two Ways to Add Indicators
- Quick Indicator Search (Ctrl + I): Press Ctrl + I or click Indicators on the main toolbar, type e.g.
EMA,RSI,MACD,SuperTrend, and press Enter. - Navigator Panel (Ctrl + Shift + N): Browse indicators grouped by category (Trend, Oscillators, Volatility, Volume, Bill Williams, and Custom SDK Plugins). Double-click any indicator to attach it.
Community vs. Pro Indicator Quota
- Community Edition: Up to 3 active indicators per chart (a subtle
X/3quota badge appears in the chart header). - Pro Edition / 28-Day Trial: Unlimited active indicators per chart and full support for external
PTView.SDKC# plugins.
2. Managing, Reordering & Customizing Indicators
Open the Indicator Manager from the chart overlay badge or Chart → Indicators:
- Drag-and-Drop Reordering: Drag sub-pane indicators (like RSI or MACD) up or down to rearrange sub-pane order cleanly.
- Edit Parameters & Colors: Double-click any indicator plot line (or click the gear icon) to customize periods, multipliers, price source (
Close,Open,High,Low,HL2,HLC3), line width, stroke style, colors, and cloud/band fill opacity. - Child / Composite Indicators: Apply an indicator (such as an EMA or SMA) directly onto another indicator's output series (e.g. a smoothed moving average over RSI).
- Show / Hide / Remove: Toggle visibility with the eye icon without deleting your custom parameters, or click the trash icon to remove it.
3. Built-In Indicator Categories
| Category | Popular Included Indicators |
|---|---|
| Trend | Simple Moving Average (SMA), Exponential Moving Average (EMA), DEMA, TEMA, Hull Moving Average (HMA), VWMA, SuperTrend, Parabolic SAR, Ichimoku Cloud, Alligator |
| Oscillators | RSI, MACD, Stochastic, Stochastic RSI, CCI, Awesome Oscillator (AO), Accelerator Oscillator (AC), DeMarker, Momentum, Williams %R |
| Volatility | Bollinger Bands, Bollinger BandWidth, Donchian Channels, Keltner Channels, Average True Range (ATR), Moving Average Envelopes |
| Volume | On-Balance Volume (OBV), Volume Profile / Spike, Money Flow Index (MFI), Accumulation/Distribution, VWAP |
| Bill Williams | Fractals, Gator Oscillator, Market Facilitation Index |
Ask AI Copilot to Configure Indicators
With AI Copilot (Ctrl + T), you can simply type: "Add EMA 20 in blue, EMA 50 in gold, and RSI(14) below the chart" and PTView attaches and styles them automatically.