Drawing Tools & Chart Annotations
PTView includes a full suite of interactive drawing tools on the left Drawing Toolbar so you can mark trendlines, order blocks, Fibonacci levels, and trade notes directly on the chart.
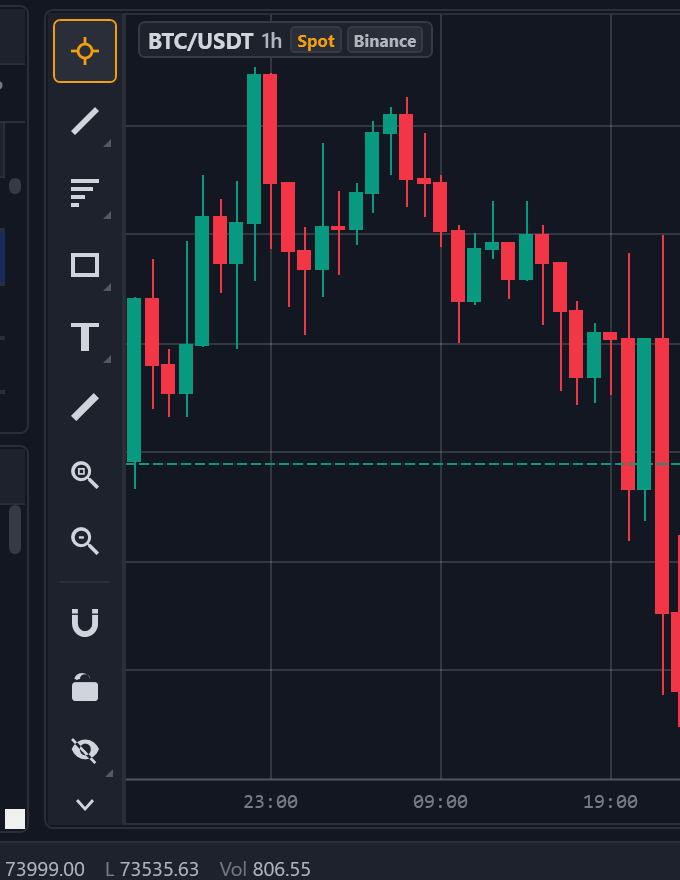
1. Toolbar Controls & Quick Helpers
Press Alt + D anytime to show or hide the Drawing Toolbar. When you click any existing drawing on the chart, a Floating Drawing Mini-Bar pops up for 1-click color, thickness, line pattern, lock, or delete adjustments.
| Tool Icon / Control | Purpose |
|---|---|
| Crosshair | Default cursor mode with synchronized price/time crosshair |
| Trend & Lines | Trend Line, Ray, Extended Line, Horizontal Line, Vertical Line, Trend Angle |
| Fibonacci | Fibonacci Retracement, Fibonacci Extension, Fibonacci Time Zones |
| Zones & Shapes | Rectangle Zone (Order Blocks / FVG), Ellipse, Triangle |
| Text & Notes | Text Annotation, Emoji Markers (🚀, ⚠️, 🎯), Arrow |
| Price Measurement | Measure price delta, % gain/loss, bar count, and elapsed time |
| Magnet Mode | Automatically snaps endpoints to the nearest candle High, Low, Open, or Close |
| Lock All Drawings | Prevents accidental dragging while panning or zooming charts |
2. Common Trader Workflows
Mark Support / Resistance Zones
- Select Rectangle Zone (or Horizontal Line) from the left Drawing Toolbar.
- Enable Magnet Mode (horseshoe magnet icon) so the box edge snaps cleanly to candle wicks.
- Drag across the price range, then click the zone to customize fill color and opacity in the floating toolbar.
Measure Risk / Reward & Price Moves
- Select the Measurement (Ruler) tool.
- Click at your entry candle and drag to your target or stop level — PTView displays the exact dollar move, % change, number of bars, and elapsed duration.
Manage All Drawings (Ctrl+Shift+D)
- Select & Move: Click any object to reveal resize handles; drag the middle handle to move.
- Clone: Hold Ctrl while dragging an object to duplicate it.
- Delete: Press Delete on a selected object, or open Drawing Manager (Ctrl + Shift + D) to filter, toggle visibility, lock, or delete multiple drawings across panes.
Draw with AI Copilot
You can also ask AI Copilot (Ctrl + T) to draw for you, e.g. "Highlight the 64,200–64,600 support zone with a green box and mark the recent swing high with a Fibonacci Retracement."