Workstation UI & Chart Navigation
PtView Workstation is organized into clear, customizable zones modeled after professional trading terminals. Every panel can be toggled, resized, or restored automatically between sessions.
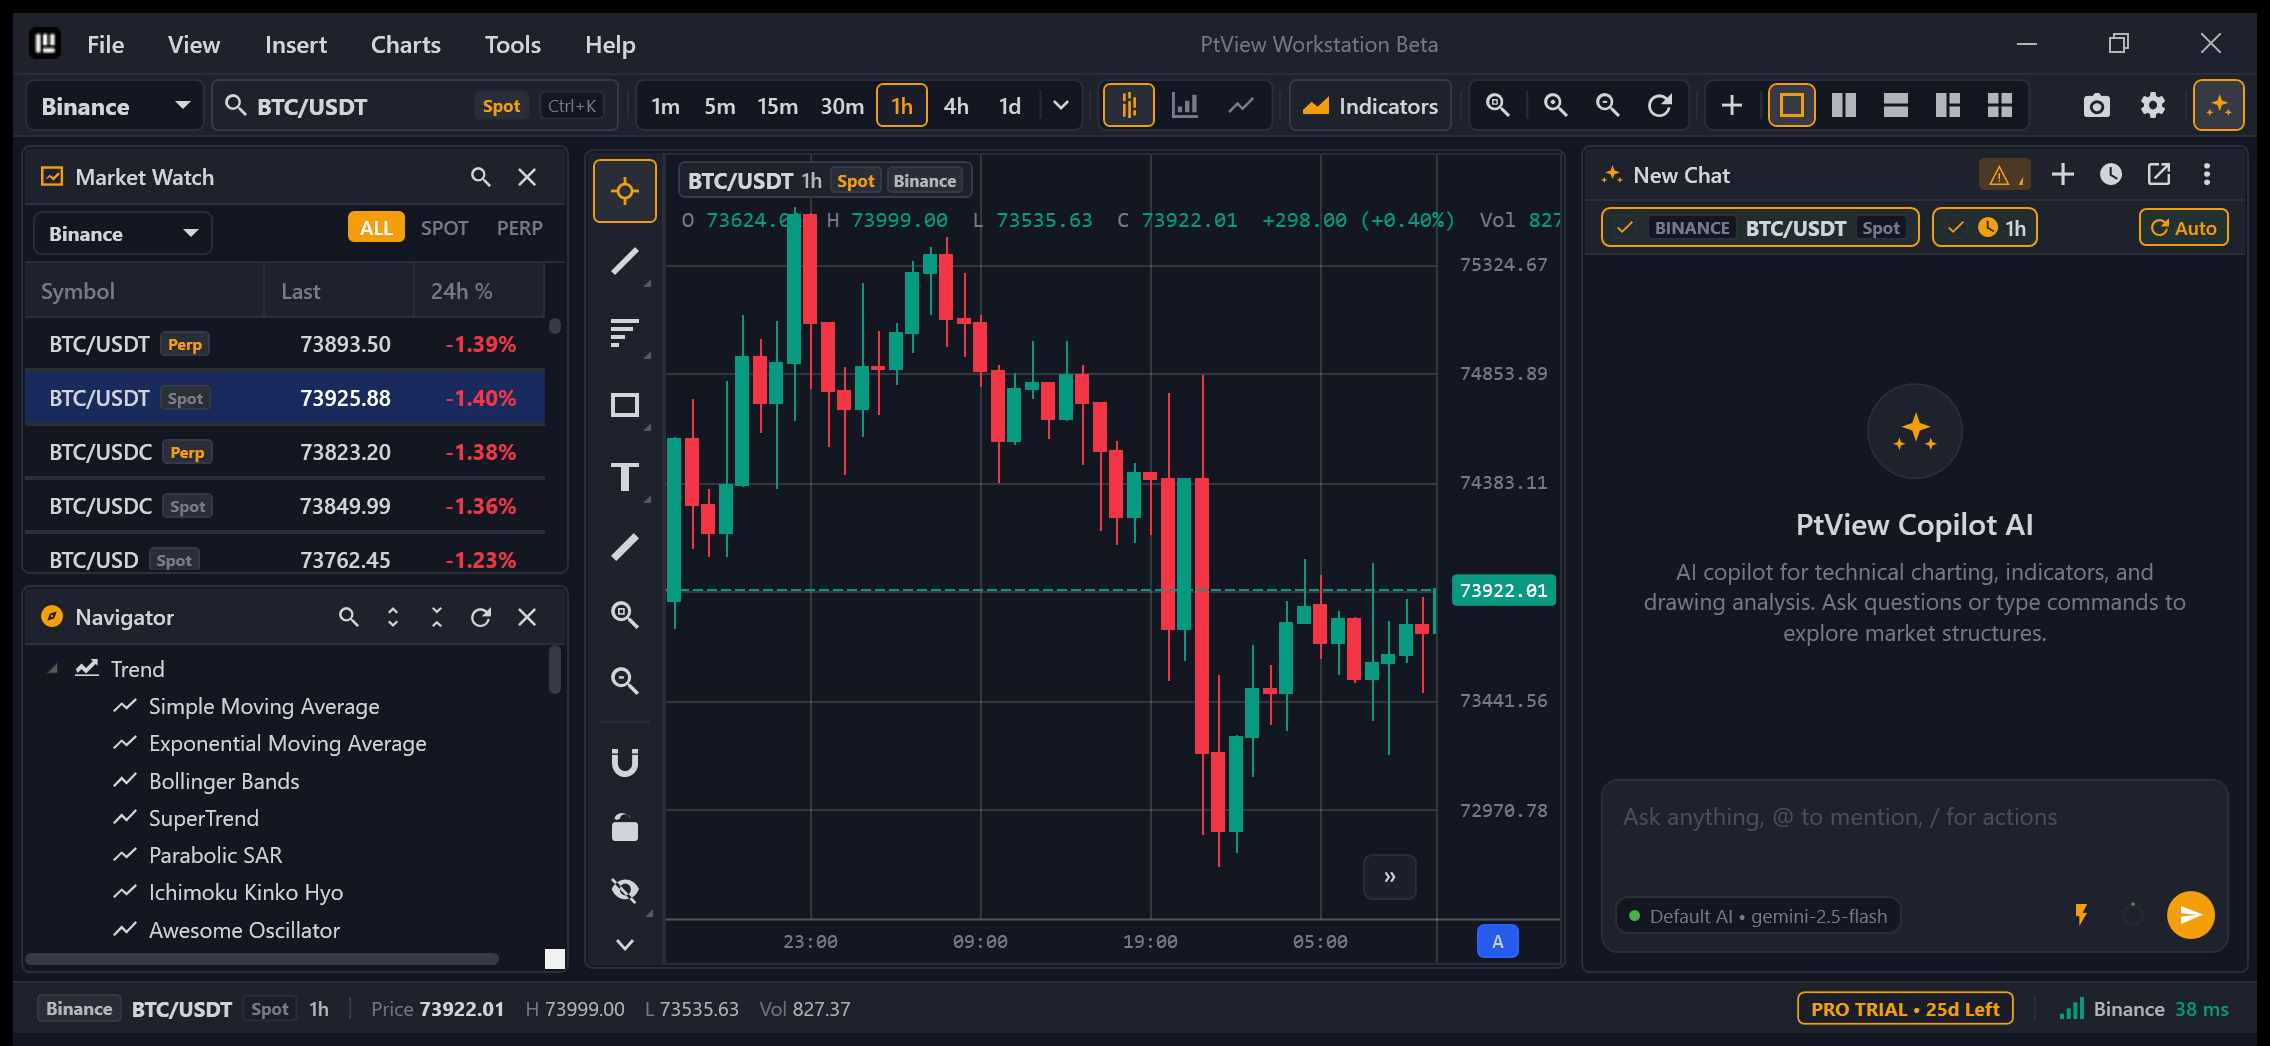
1. Top Menu Bar & Main Toolbar

Top Menu Bar
| Menu | What's Inside |
|---|---|
| File | New Chart (Ctrl + N), Save Workspace (Ctrl + S), Load Workspace (Ctrl + O), Exit (Alt + F4) |
| View | Toggle Market Watch (Ctrl + M), Navigator (Ctrl + Shift + N), Data Window (Ctrl + D), AI Copilot (Ctrl + T), Fullscreen (F11) |
| Insert | Quick Indicator Search (Ctrl + I), Drawing Tools |
| Charts | Timeframe submenu, Chart Type (Candlestick / Bar / Line), Box Zoom (Alt + Drag), Undo Zoom (Alt + Z), Zoom In/Out/Reset |
| Tools | AI Settings, Screenshot (Ctrl + Shift + S), Options / Settings (Ctrl + P) |
| Help | Keyboard Shortcuts (F1), Documentation, PTView.SDK, Open Logs Folder, Export Diagnostics .zip, View License, Privacy Statement, Check for Updates... / Restart to Update, About |
Main Toolbar (Left to Right)
- Exchange Selector: Switch active exchange (
OKX,Binance,Bybit, and all 29 enabled venues). - Quick Symbol Button (Ctrl + K): Shows active pair +
Spot/Perpbadge. Click to search across all enabled exchanges. - Timeframe Cluster: One-click intervals (
1m,5m,15m,30m,1h,4h,1d) plus thevdropdown to pin custom timeframes (3m,2h,6h,12h,3d,1w, etc.). - Chart Type Selector: Toggle between Candlestick, OHLC Bar, and Line charts.
- Indicators Button (Ctrl + I): Open the Quick Indicator Search popup.
- Zoom Controls: Box Zoom (Alt + Drag), Zoom In (Ctrl + +), Zoom Out (Ctrl + -), and Reset Auto-Fit (Ctrl + 0).
- Multi-Chart Layout Switcher: Add pane (
+) and switch between Single, Split Vertical, Split Horizontal, 3 Charts, and Grid 2×2 (Pro / 28-day Trial). - Right Quick Actions: Snapshot Camera (Ctrl + Shift + S), AI Copilot (Ctrl + T), and Settings (Ctrl + P).
2. Market Watch & Navigator Panels
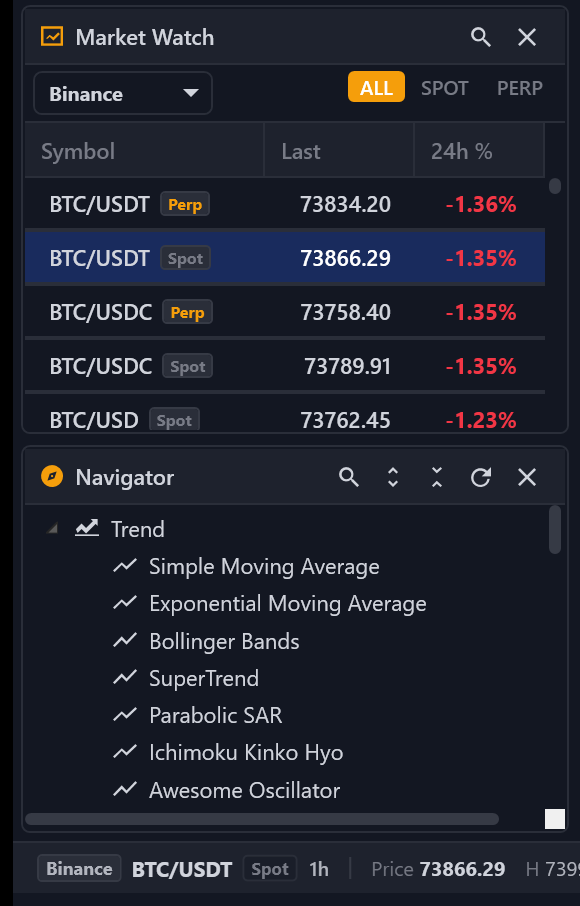
Market Watch (Ctrl + M)
- Filter by Exchange or market type (ALL, SPOT, PERP, INVERSE).
- Click the magnifying glass icon to filter pairs live.
- Displays Last Price, 24h % Change (with live green/red tick flashes), and optional 24h High, Low, and Volume columns (right-click header to toggle columns).
- Double-click any row to open it in the active chart, or right-click → Open in New Tab.
Navigator (Ctrl + Shift + N)
- Browse all 40+ built-in indicators and installed custom
PTView.SDKplugins organized by category (Trend, Oscillators, Volatility, Volume, Bill Williams). - Double-click or right-click → Attach to Active Chart to add an indicator immediately.
3. Chart Canvas, Zoom & Data Window
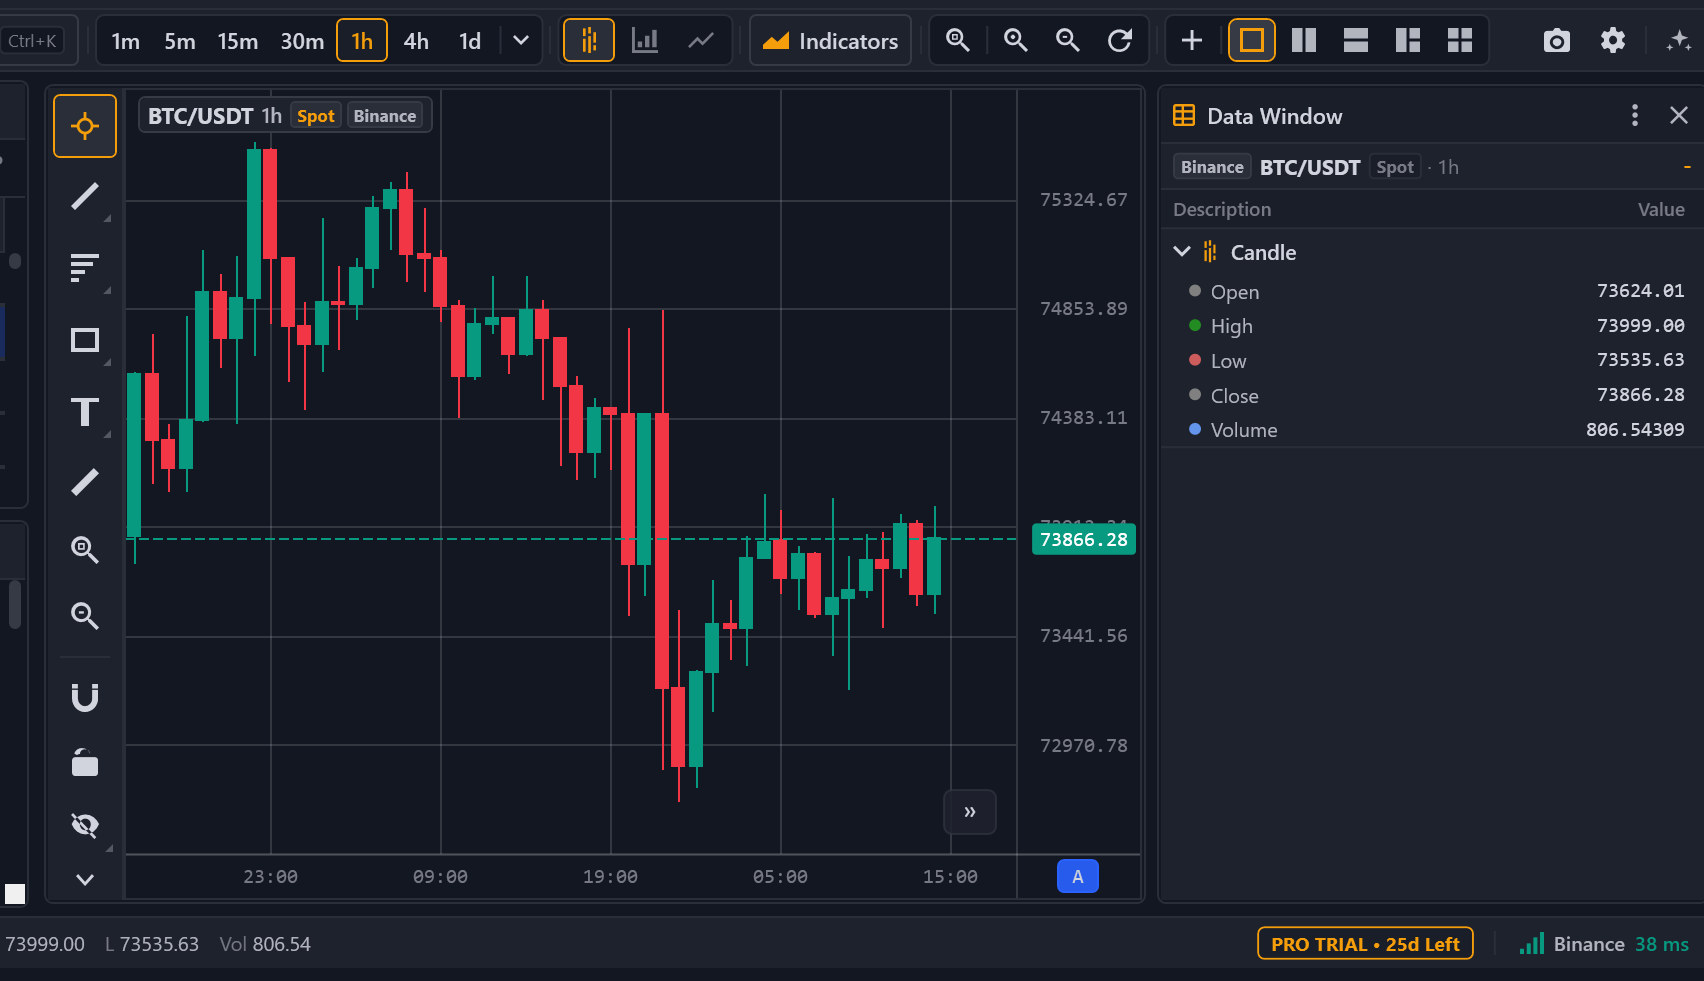
Smooth Chart Zoom & Axis Controls
- Mouse Wheel: Zoom horizontally in/out centered on your cursor.
- Drag Price Axis (Right): Stretch or compress vertical price scaling; double-click the price axis (or click
A) to return to Auto-Fit. - Drag Time Axis (Bottom): Stretch or compress candle spacing horizontally.
- Box Zoom (Alt + Drag): Click the Box Zoom button (or hold Alt and drag a rectangle) to zoom straight into a specific price/time zone. Press Alt + Z to step back or Ctrl + 0 to reset.
Data Window (Ctrl + D)
- Docks beside your chart to display exact values at the cursor position: Open, High, Low, Close, Volume, plus real-time numerical outputs for every active indicator line.
Automatic Workspace Persistence
- Your open chart tabs, multi-chart grid layout, symbols, timeframes, indicators, and drawing objects are saved automatically and restored on your next launch.
- Switch between 4 built-in themes (Dark, Midnight OLED, CyberNavy, Light) anytime in Settings → General.