5-Minute Quick Start Guide
New to PtView Workstation? Follow these 5 simple steps to install the app, open your first live crypto chart, attach indicators, and run your first AI analysis.
Step 1: Download & Install (Windows)
- Go to PTView Releases and download:
PTViewWorkstation-win-Setup.exe(Recommended) — 1-click installer with automatic background updates and Start Menu shortcut.PTViewWorkstation-win-Portable.zip— Extract anywhere and launchPTView.Desktop.exedirectly (great for USB or restricted PCs).
- Double-click the installer. No Administrator privileges are required.
Windows SmartScreen Notice
If Windows displays "Windows protected your PC" on a new Beta build, click More info → Run anyway. Checksums for every release file are published in checksums-sha256.txt on the release page.
Step 2: Complete the First-Launch Setup Wizard
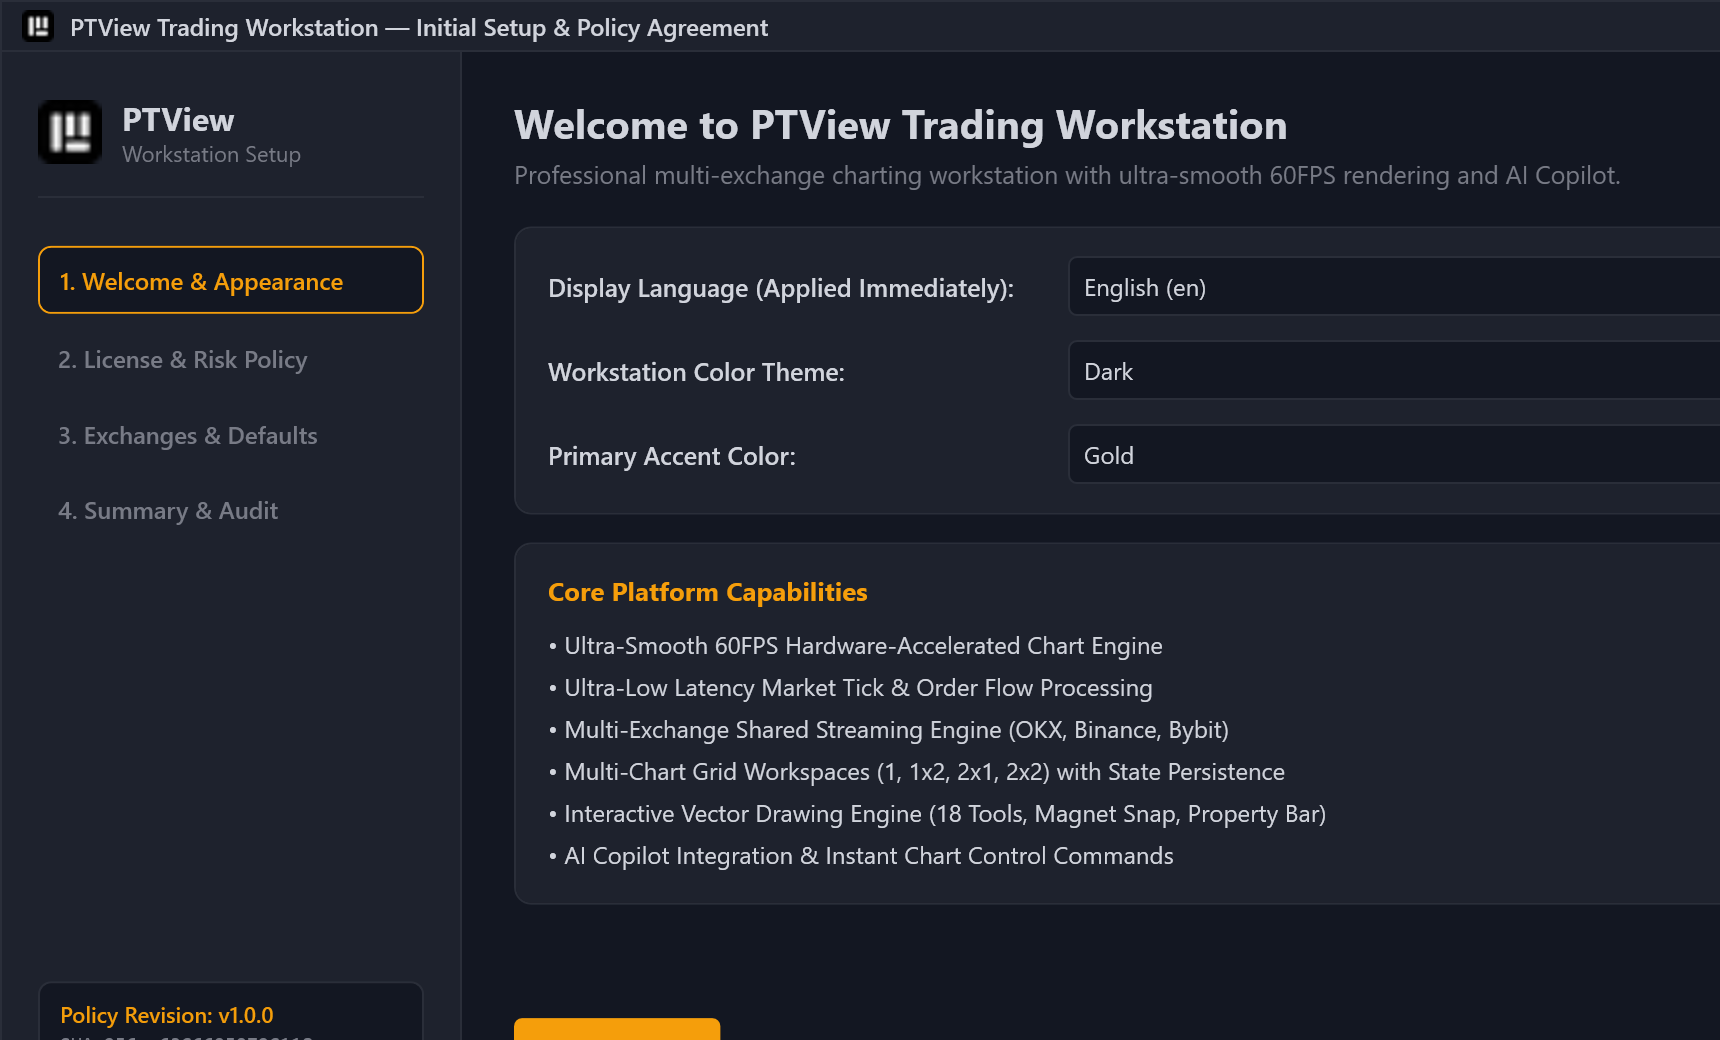
On first launch, the Workstation Setup Wizard walks you through 4 quick screens:
- Welcome & Appearance: Choose your language (English or Tiếng Việt), visual theme (Dark, Midnight OLED, CyberNavy, or Light), and accent color.
- License & Risk Policy: Review and check both acknowledgments (Software License & Trading Risk Disclaimer).
- Exchanges & Defaults:
OKX,Binance, andBybitare enabled by default — or enable any of the 29 supported exchanges right away. - Summary & Finish: Click Finish to launch the workstation with an automatic 28-day complimentary Pro trial.
Step 3: Pick a Coin, Timeframe & Chart Layout
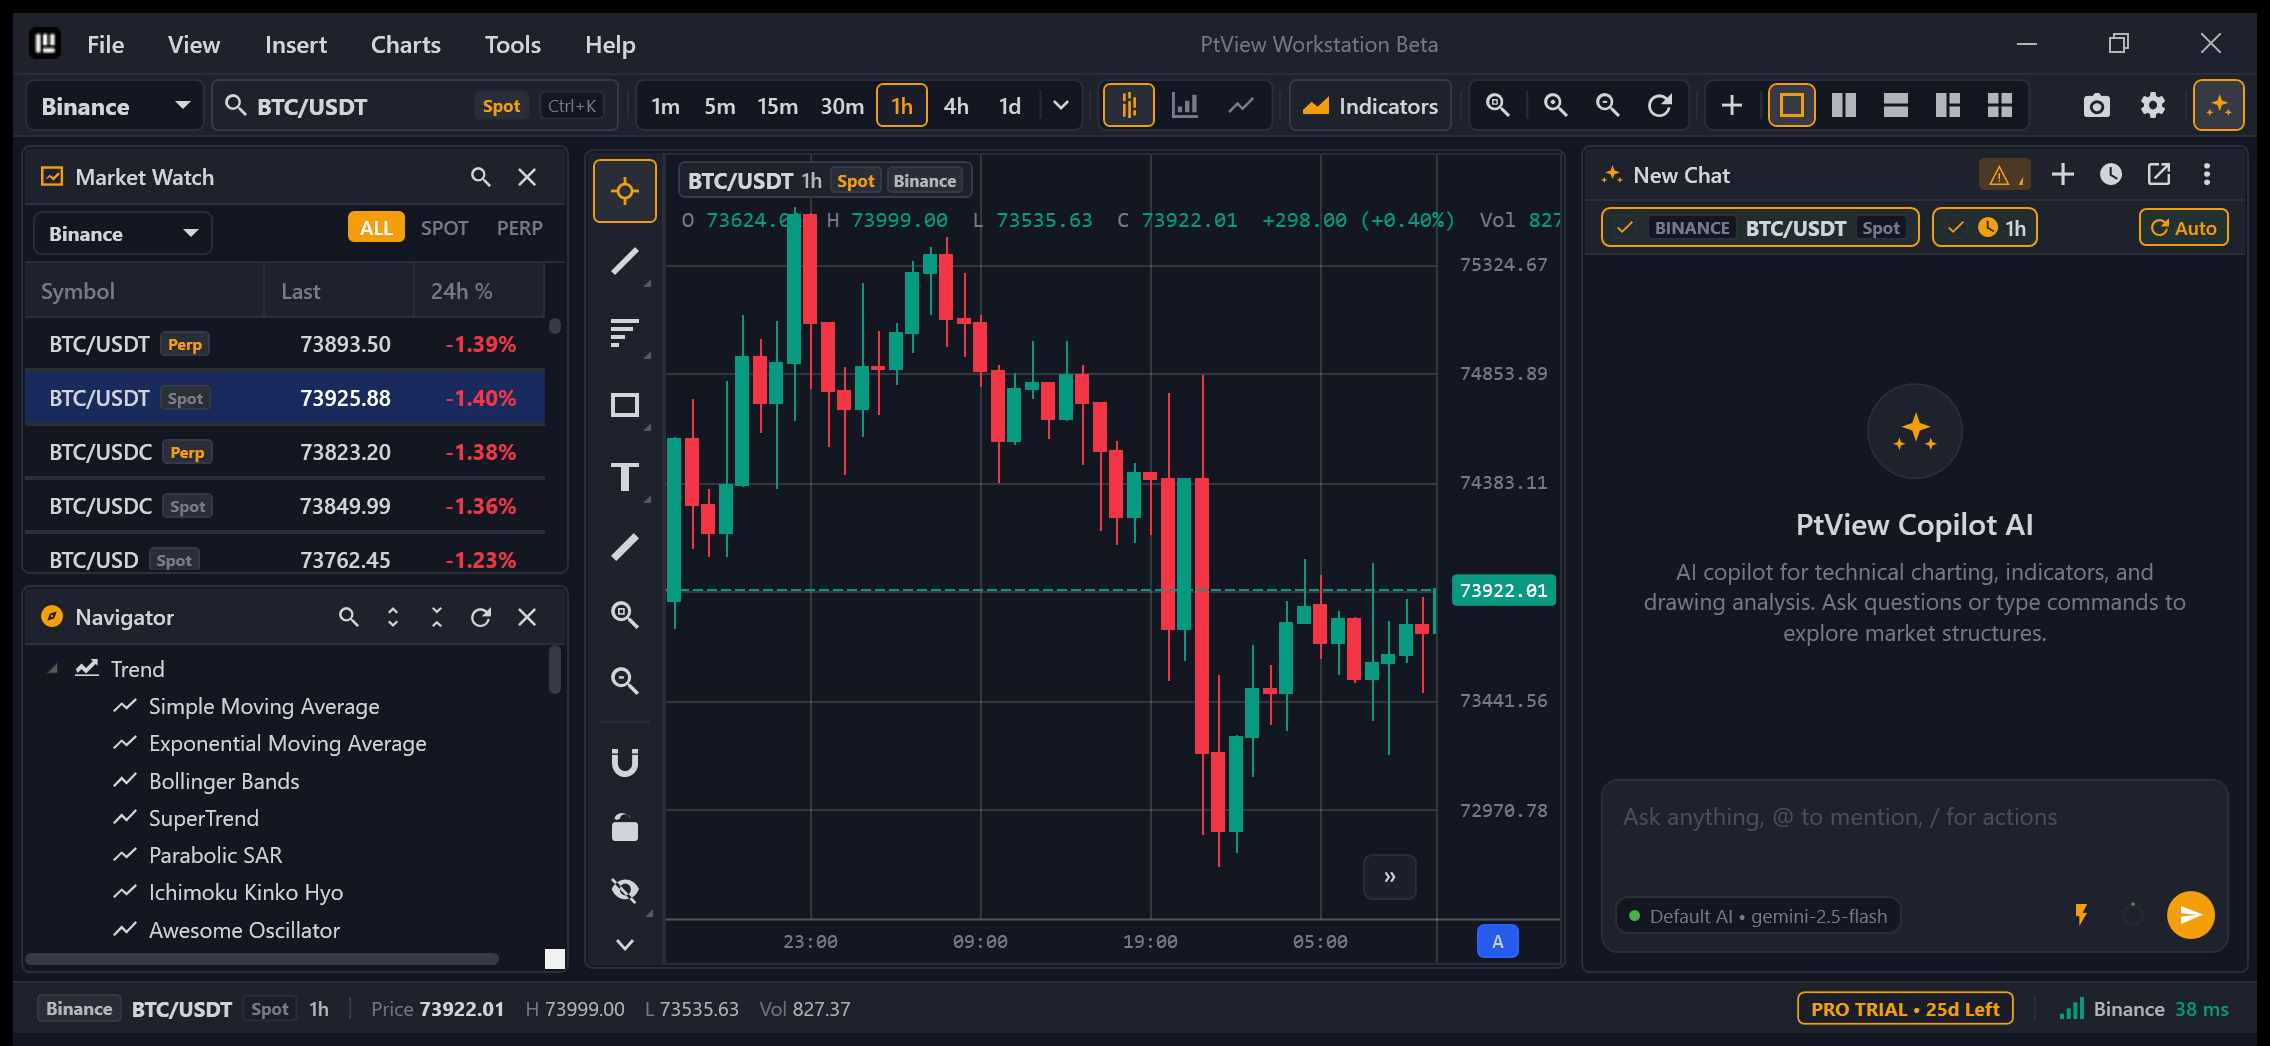
- Switch Exchange: Use the exchange dropdown on the top-left toolbar (or filter inside Market Watch
Ctrl+M). - Search Any Pair (
Ctrl+K): PressCtrl+K(or click the pair badge on the toolbar), type e.g.BTC,ETH,SOL, and choose Spot or Perp. - Change Timeframe: Click
1m,5m,15m,30m,1h,4h,1don the toolbar — or click the dropdown arrow to customize your favorite pinned intervals. - Multi-Chart View: Click the layout pills on the toolbar to switch between 1 Chart, 2 Split, 3 Charts, or 2×2 Grid (available in Pro / 28-day Trial).
Step 4: Add Indicators & Draw Levels
- Add an Indicator (
Ctrl+I): PressCtrl+I, search forEMA,RSI,MACD, orBollinger, and pressEnter. Or browse by category in the Navigator panel (Ctrl+Shift+N). - Draw Support / Resistance / Trendlines: Pick a tool on the left Drawing Toolbar (Trend Line, Horizontal Line, Rectangle Zone, Fibonacci Retracement). Turn on Magnet Mode to snap cleanly to candle highs/lows.
- Zoom & Navigate: Scroll the mouse wheel to zoom, drag the price or time axis to stretch, or hold
Alt+Dragto Box Zoom into any region (Ctrl+0resets auto-fit).
Step 5: Optional — Enable AI Copilot (Ctrl+T)
- Open Tools → AI Settings and click Add under AI Accounts (see AI API Keys & Accounts Setup for Gemini Free, OpenAI, DeepSeek, or local Ollama step-by-step instructions).
- (Optional) Connect a Telegram alert bot in 2 minutes: Telegram Bot Alerts Setup.
- Press
Ctrl+Tto open AI Copilot on the right panel and ask in plain language:- "Summarize the current 1h trend and mark key support/resistance zones."
- "
/scheduleevery 15m check RSI and funding rate --notify"
Read-Only Safety
AI Copilot only reads market data and draws/annotates charts — it never places orders or accesses exchange trading funds. You do not need any exchange API key just to view charts or use AI analysis.